Money and Politics in US House of Representatives Elections

Context
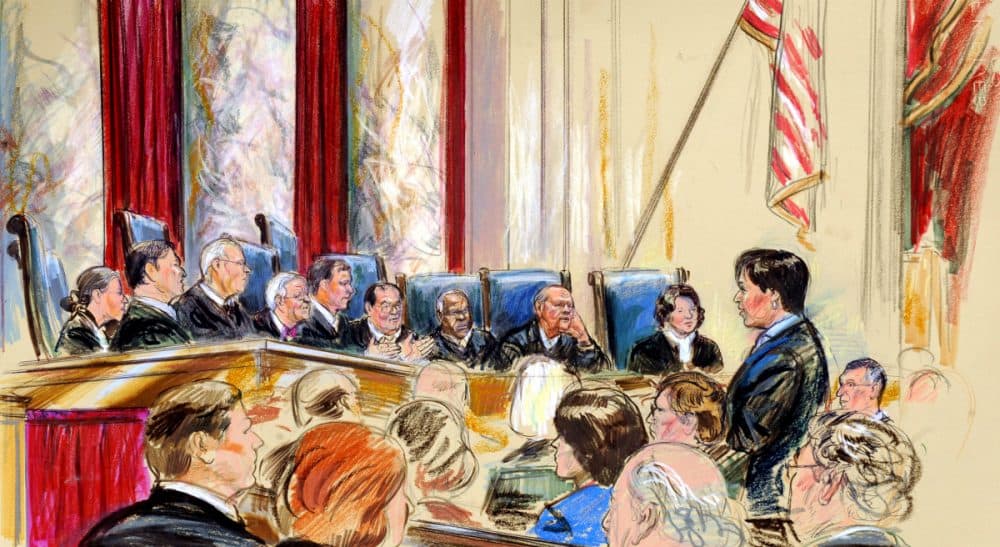
As we near the 2024 presidential vote, I have heard several discussions of the corrupting influence of money in American politics from journalists and pundits inside and outside the United States. They argue that since Citizens United which, plainly put determined that Money is Speech, enshrining the ability for firms or individuals to donate huge sums to political candidates.
Many argue that this allows politicians to be influenced by big donors who sometimes will donate to both candidates in a race to ensure their influence regardless of the outcome. I do not consider implicit bias in favor of the donor’s agenda here. I wanted to tackle a far simpler question: in our modern age of targeted advertising and dense information ecosystems, “Does money facilitate election wins?”
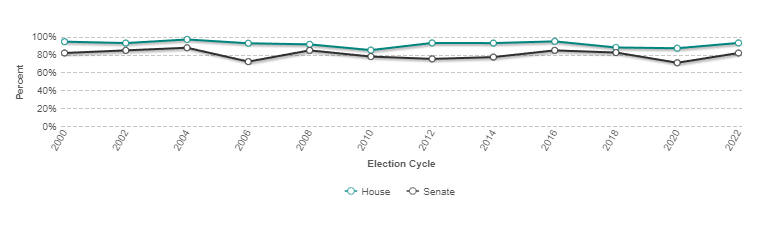
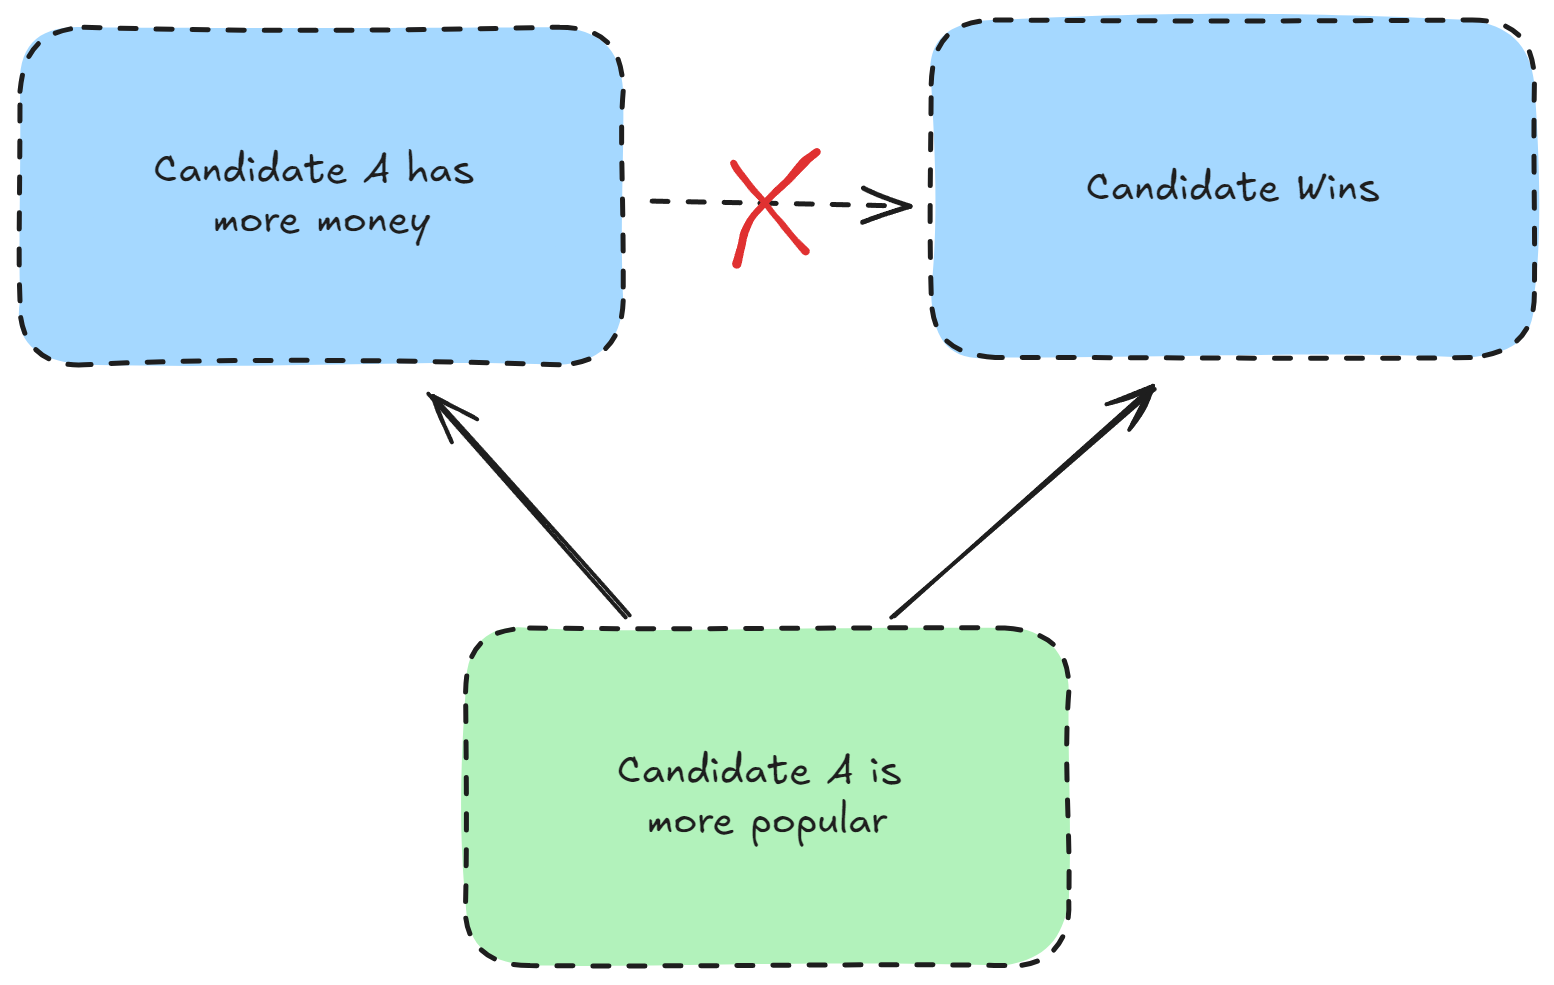
It is no secret that the top spending candidate wins almost all of the time. This post was inspired by someone stating “In 2022, the candidate with more money won over 93% of the time.” But we would expect this regardless. Let’s suppose we have hypothetical candidates A and B. Candidate A is well-liked by her constituents and as a result receives a large amount of donations. Candidate B is not well-liked and receives fewer donations. Candidate A wins AND is better funded because she is more popular. Therefore, a more in-depth is needed to evaluate whether having more money is unduly beneficial.
Methods
Datasets: For this analysis I combine FEC campaign finance data (FEC 2024), election results data (Lab 2024), and overall election data for Cook PVIs (Cook PVI℠ 2023) and national vote totals from Wikipedia (e.g. Wikipedia 2021). The code and data for the analysis can be found here.
Restrictions of the Dataset: I consider districts during the period 2012-2020 to avoid redistricting between years in the dataset. I only consider races between a registered Democrat and Republican candidate.
Variables: The independent variable is the spending ratio between the winning candidate and the runner-up. The dependent variable is the Margin of Victory (%) or Adjusted Margin (%). Adjusted Margin was calculated to control for the political bias of the district and the country. To control for the political bias of the district, I adjust the Margin of Victory by the Cook PVI for the district (it is best to think of this as calculating the under- or over-performance of the candidate based on the political lean of the district). I also adjust by what I am calling the “National House Environment” which is just the difference between the percentage of all Americans who voted for Republican candidates and those who voted for Democratic candidates. This adjustment was an attempt to control for the influence of the environment of the nation and media on the voting of “swing” voters in each district. I did not control for incumbency, but I separately analyzed cases where incumbents were not present.
Findings
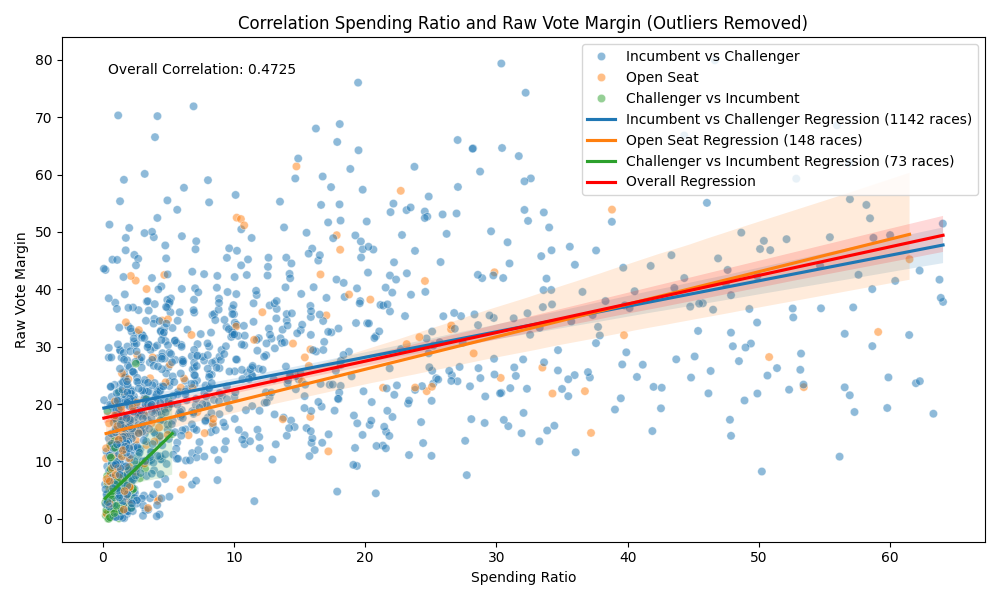

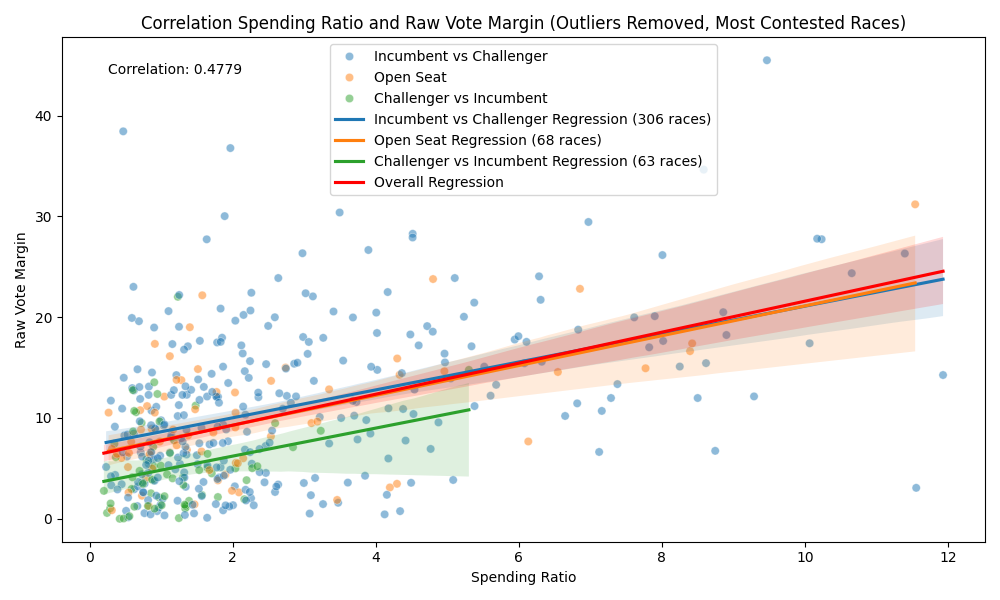
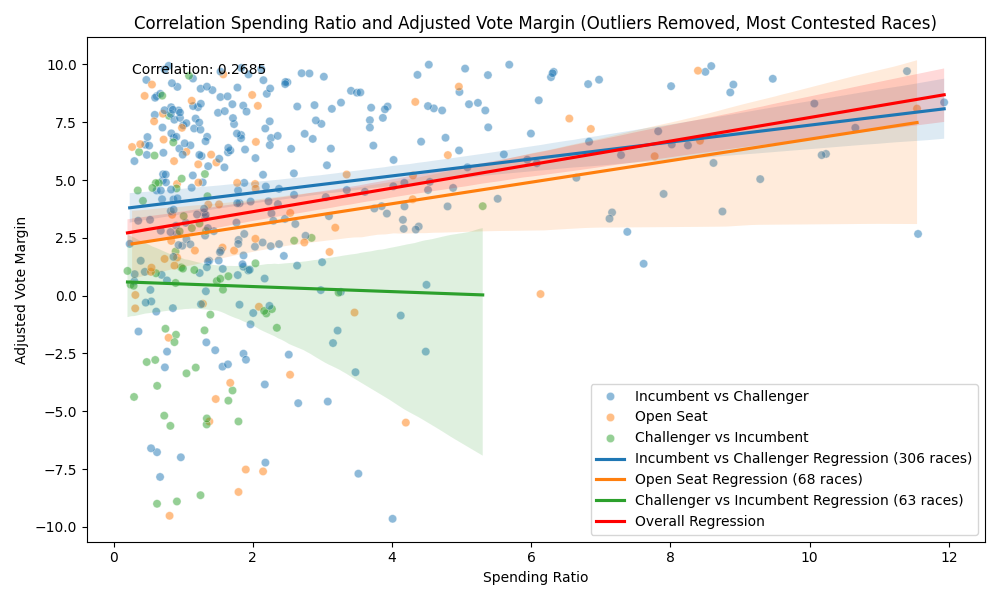
As I hypothesized, the correlation decreases when using the Adjusted Margin. With an overall correlation of .27, the relationship between the Spending Ratio and Adjusted Margin is weak but not negligible. Most of the data is from races where Incumbents are present and win, which is extremely common in US House races. Thus, I broke down the correlations by race type (data from “most contested races”):
- Overall correlation between Spending Ratio and Adjusted Vote Margin (n=437): 0.2685
- Correlation for Incumbent vs Challenger (n=306): 0.2263
- Correlation for Open Seat (n=68): 0.2243
- Correlation for Challenger vs Incumbent (n=63): -0.0215
While there are much fewer races where the Challenger beats the Incumbent (n=63 “most contested races” or n=73 “all races”), it is interesting that there is no correlation between spending ratio and adjusted margin in these cases.
Discussion
FiveThirtyEight’s piece “How Money Affects Elections” looks at this issue from a more qualitative perspective based on the work of some prominent researchers in the field. They raise a few interesting ideas that mesh with my findings:
… early fundraising strongly predicted who would win primary races. …advertising is useful for making voters aware that a candidate or an issue exists at all. (Koerth 2018)
… the strong raw association between raising the most cash and winning probably has more to do with big donors who can tell (based on polls or knowledge of the district or just gut-feeling woo-woo magic) that one candidate is more likely to win — and then they give that person all their money. (Koerth 2018)
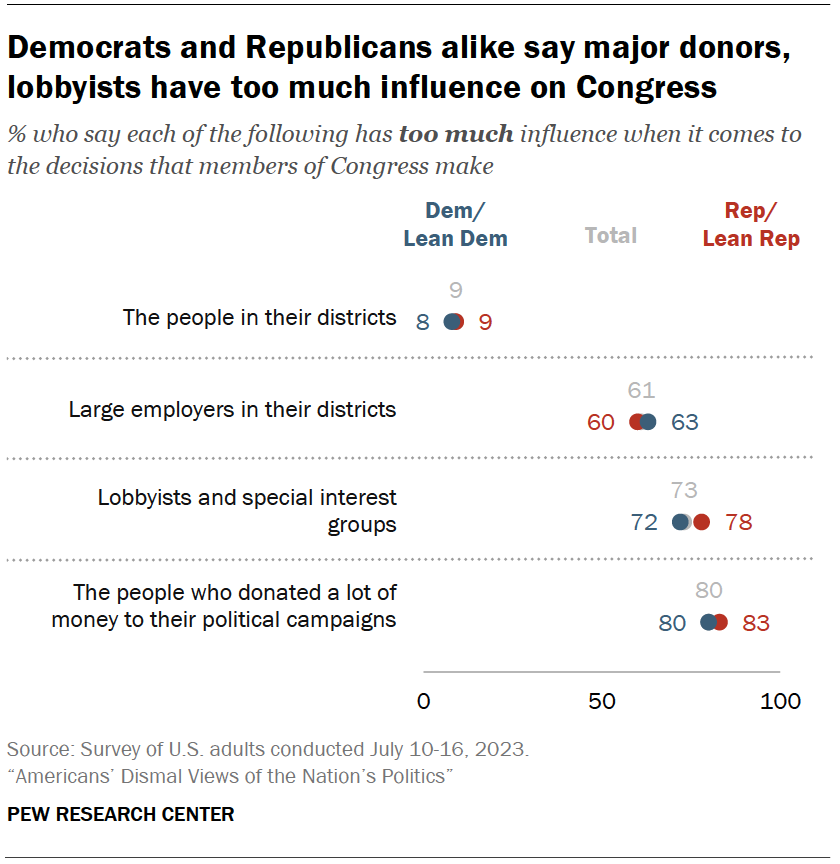
Based on the relatively weak correlations I found and the views of various authors on this topic, money influences elections, but in a far more minor way than one would expect. Money is most relevant when a challenger attempts to defeat an incumbent or when a seat is open. Thus, money, to an extent, can be a barrier to entry into the political fray. Regarding eroding American democracy, I would contend that money is primarily an issue in elections due to the negative impact on voter perceptions (see Figure 1). Once politicians get into office, however, the influence of such donations can take a far more corrosive toll.